1.0.1 Electrochemistry
1.0.1.1 Electrochemical Systems
Electrochemistry is the study of the relationship between chemical changes and electrical energy. Electrochemical systems facilitate chemical change to generate electricity, or they can use electricity to invoke chemical change. The electrochemical cell is a container where the conversion from electrical energy to chemistry and vice versa is performed. Electrolyzers are an example of an electrochemical cell, electrolyzers are designed to convert electrical energy into useful chemical products such as hydrogen gas from water, or hydrocarbons from CO2. By applying an electric potential to the electrolyzer, electrons have the sufficient energy to participate in chemical reactions. On the other hand, fuel cells utilise chemical reaction to harness free electrons and provide electrical energy. In a hydrogen fuel cell, the reaction between hydrogen and oxygen gas into water gives off electrons. Batteries present an example of a cell where electrical energy can be both stored and released via a reversible chemical reaction depending on whether it is being charged or discharged. These electrochemical systems have become increasingly common and will play a critical role in buffering variable renewable energy sources. The clean energy transition will rely heavily on wind and solar energy, and de-carbonizing fossil fuel reliant industries such as passenger vehicles and chemical feedstock production.

1.0.1.2 The Cell
An electrochemical cell is a device that facilitates the conversion between chemical and electrical energy. The cell is typically composed of two dissimilar materials referred to as the cathode and the anode, these materials are separated by an electrically conductive medium known as an electrolyte. Cells are classified as either Galvanic or Electrolytic, this is based on whether the electrochemical reactions occur spontaneously or non-spontaneously, respectively. Diagram 1 illustrates a galvanic cell connected to a load, during operation the anode undergoes an electrochemical reaction causing electrons and positive ions to move towards the cathode to reduce. The flow of the electrons through the load as they move to the cathode provides the system with power. An example of a galvanic cell would be a discharging battery or a fuel cell in operation.
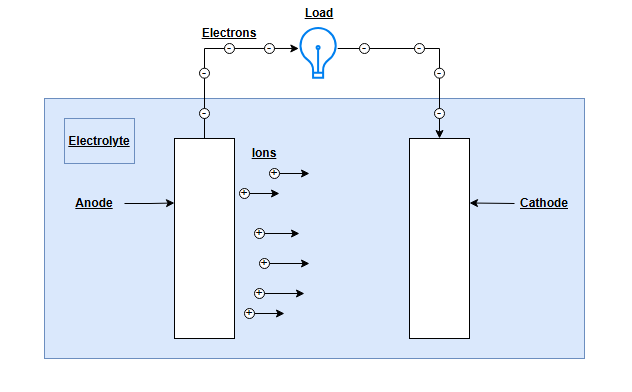
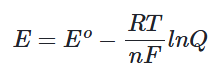
The driving force of this reaction is dictated by the composition of the electrodes and resulting cell potential. Cell potential is the difference in electrical potential energy between the electrodes and is measured in volts. Electrons naturally want to move from high to low potential, so if the anode has a higher potential than the cathode a spontaneous reaction will occur. Cell potential can be calculated using the Nernst equation which factors in the potential difference under standard conditions, along with the influence of non-standard conditions such as concentration gradients (Q) or temperature (T).
Electrolytic cells do not undergo a spontaneous reaction and thus require an external source of electrical energy to drive diffusion. Examples of electrolytic cells would be a charging battery, or an electrolyzer splitting molecules into useful chemical components. This process is fundamental to electrochemical energy storage. Cells may be connected electrically in series, parallel, or both to create energy storage systems and chemical production systems at larger scales.
1.0.1.3 The Electrode Interface
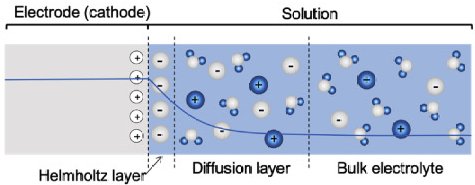
Positive ions travel back and forth through the electrolyte to bond with electrons at the interface of the electrodes. The Helmholtz, or electrical double layer is a region of oppositely charged ions that are held close to an electrode to keep a neutral charge balance, much like two plates in a capacitor. Beyond the double layer is the diffusion layer, this is a concentration gradient of ions that builds as ions are consumed by electrochemical reactions at the electrode surface. At the boundary of the diffusion layer, the electrolyte solution is at its standard concentration. As the distance increases from the electrode the potential and driving force for diffusion decreases [1].
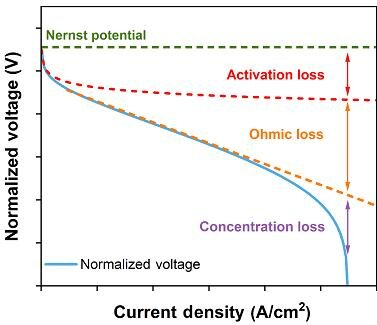
Polarization refers to a deviation from the standard potential that exists between two electrodes. The electrical energy that is put into the cell when polarized is consumed by charge transfer reactions, ohmic losses, and reaction activation. These phenomena facilitate charge transfer in the electrodes during cell operation, and the polarization is the resulting in the cell’s potential energy. The plot below is an example of a polarization curve for a redox flow battery, this showcases the potential dropping as charge is transferred during anode oxidization (discharge) [2].
1.0.1.4 Summary and Examples
In this module, we covered what makes up an electrochemical cell and how it operates, however, the most defining feature of an electrochemical system are its active materials. Active materials are substances that participate in the chemical reactions taking place within the electrochemical cell and are commonly found at the electrodes. For example, a Lithium-ion battery may have a graphite anode, a Nickel-Manganese-Cobalt cathode, and Lithium ions that traverse back and forth. Table 1 is provided below to summarize the active materials in common electrochemical cells, along with some key traits.
1.0.2 Modelling the cell
Accurately modelling an electrochemical cell is useful for simulating behaviour, tracking cell performance, and managing operation, however, this can be very complex. The equivalent circuit model is commonly created to simplify the cell by using circuit elements such as resistors, capacitors, and inductors to emulate cell components and processes. Using a circuit representation the chemical and physical understanding of the cell’s innerworkings can be linked to its electrical behaviour. The diagram below highlights how various components of a battery cell are translated to electrical circuit elements.
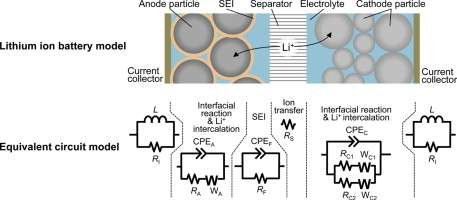
Resistors represent instantaneous losses in the cell in the form of voltage drops. Phenomena such as degradation of components or contact resistances between the electrodes and current collectors can manifest as an increase in ohmic resistance. Capacitors represent the time dependent change in potential between two charged surfaces. In the circuit, capacitors model storage of charge in the double-layer that forms between electrode surfaces and the electrolyte. Components such as the current collectors and wiring have inductive properties that store charge in a magnetic field and can be modelled with an inductor element. Using different combinations of these circuit components, various battery chemistries, fuel cells, electrolyzers, and other electrochemical systems can be modelled [3].
1.0.2.1 Randles Circuit
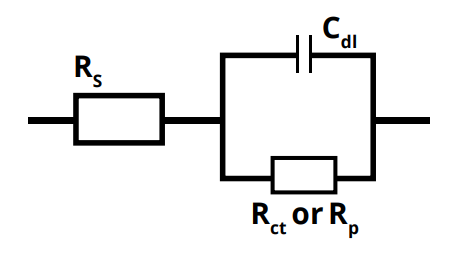
The foundation of modelling electrochemical systems with electrical circuits is the Randles Circuit. The Randles Circuit is made up of a resistor in series with a parallel branch containing a capacitor and another resistor. This is often a strong starting point for building an equivalent circuit model. As shown in the diagram below, the circuit consists of the ohmic resistance (aka the solution resistance) Rs that captures purely resistive loads within the cell, the double-layer capacitance Cdl representing the storage of charge at the surface of an electrode, and charge transfer or polarization resistance Rct/Rp which denotes the resistance associated with exchanging an electron during an electrochemical reaction.
Using the building blocks of the Randles circuit and resistor-capacitor pairs, an accurate model of the processes happening within an electrochemical cell can be created. Electrochemical impedance spectroscopy is one of the best methods for determining the correct circuit configuration and optimizing component parameters.
1.0.3 What is Electrochemical Impedance Spectroscopy?
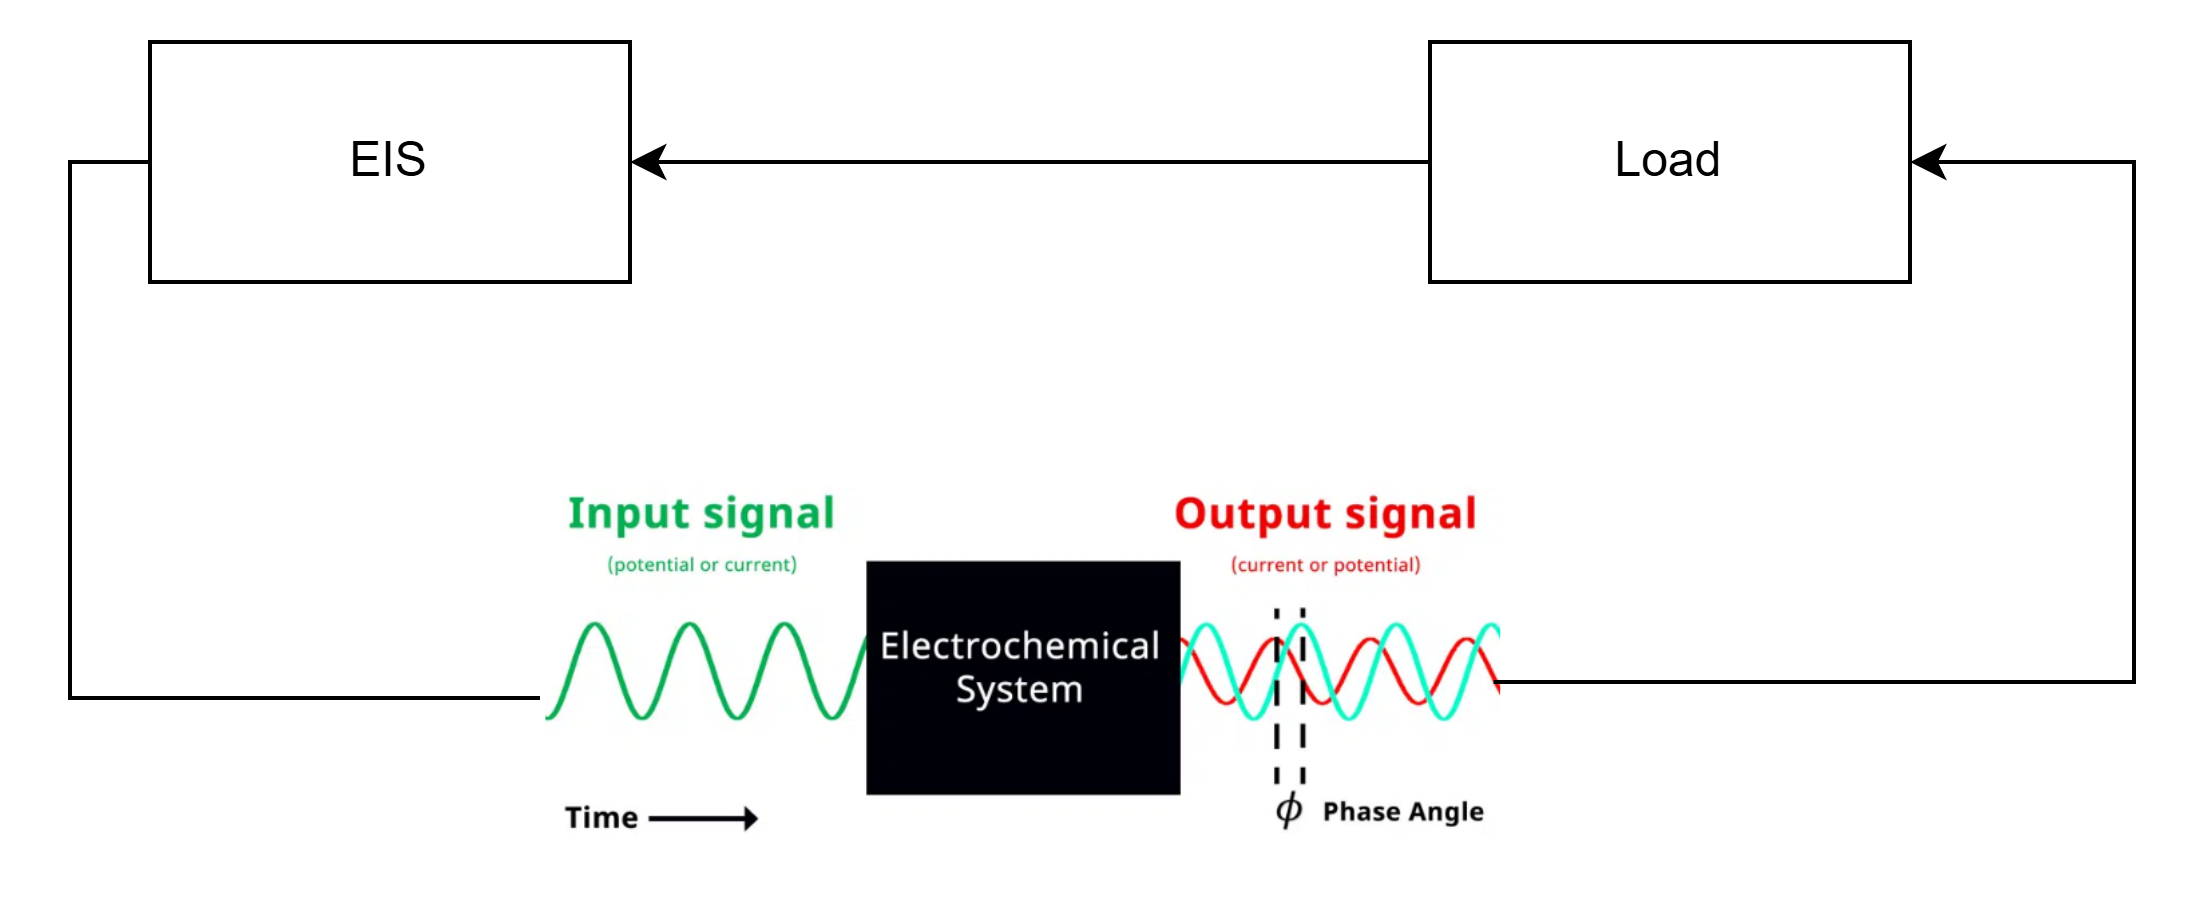
Electrochemical Impedance Spectroscopy (EIS) is a method of gaining comprehensive insights into the state of electrochemical systems using a non-invasive approach. EIS operates by sending small electrical AC signals into an electrochemical system and measuring the response. The injected AC signals are sinusoidal and delivered at a range of frequencies to probe different aspects of the system across varying time scales. These perturbations are small to maintain stability in the system and do not disrupt its operation. By using Ohm’s law, the system impedance can be determined based on the measured differences of the injected current and the voltage response. The diagram below highlights how the measured voltage response from the injected current signal is stretched vertically based on real impedance/resistance of the system and shifted horizontally in the time axis due to imaginary impedance from capacitive/inductive effects.
The measured impedance provides insights into system degradation, charge status, performance, future health, and safety. By sweeping the input signal at various frequencies the state of different components and processes are quantified, painting a detailed picture of the system’s performance. At higher frequencies, the effect of faster processes such as ohmic losses are captured, while at lower frequencies, slower processes such as diffusion are highlighted. EIS data is most commonly visualized using a Nyquist plot. This displays both the real and imaginary impedance at each measured frequency. The diagram below is an example of a Nyquist plot with impedance measurements at frequencies between 0.1 Hz and 10,000 Hz. Using the interactive sliders, we can see how the Nyquist plot’s signature changes as components of the cell change using an equivalent circuit model.
Want to learn more? Speak with us today!
